Prometheus+Grafana on CentOS Stream 9 with support by Fleximg
AWS-Marketplace
https://aws.amazon.com/marketplace/pp/prodview-6kpuom2vjg7p2
Usage Instructions
*Note
Before you start to access the system, please ensure the Status Checks of the instance in the AWS Console turns to 2/2 checks passed,
or the initialization process might be interrupted and the software configuration fails. It takes about 5-10 mins.
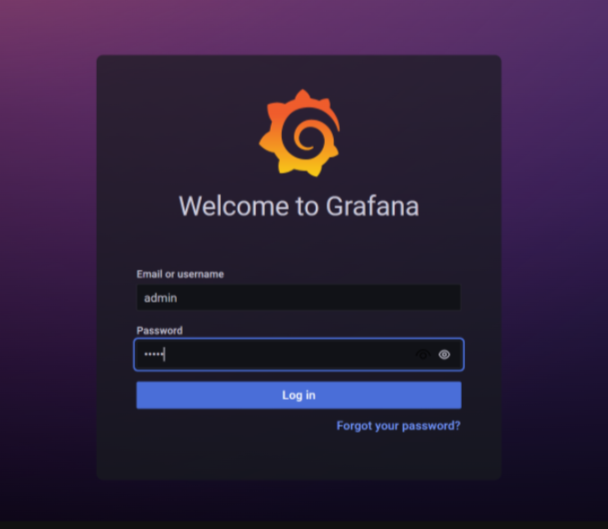
1. Log in to web
Grafana:
http://{your-host-ip}:3000/
Initial username: admin, password: Grafana!123
Prometheus:
http://{your-host-ip}:9090/
Node Exporter at http://{your-host-ip}:9100/metrics/
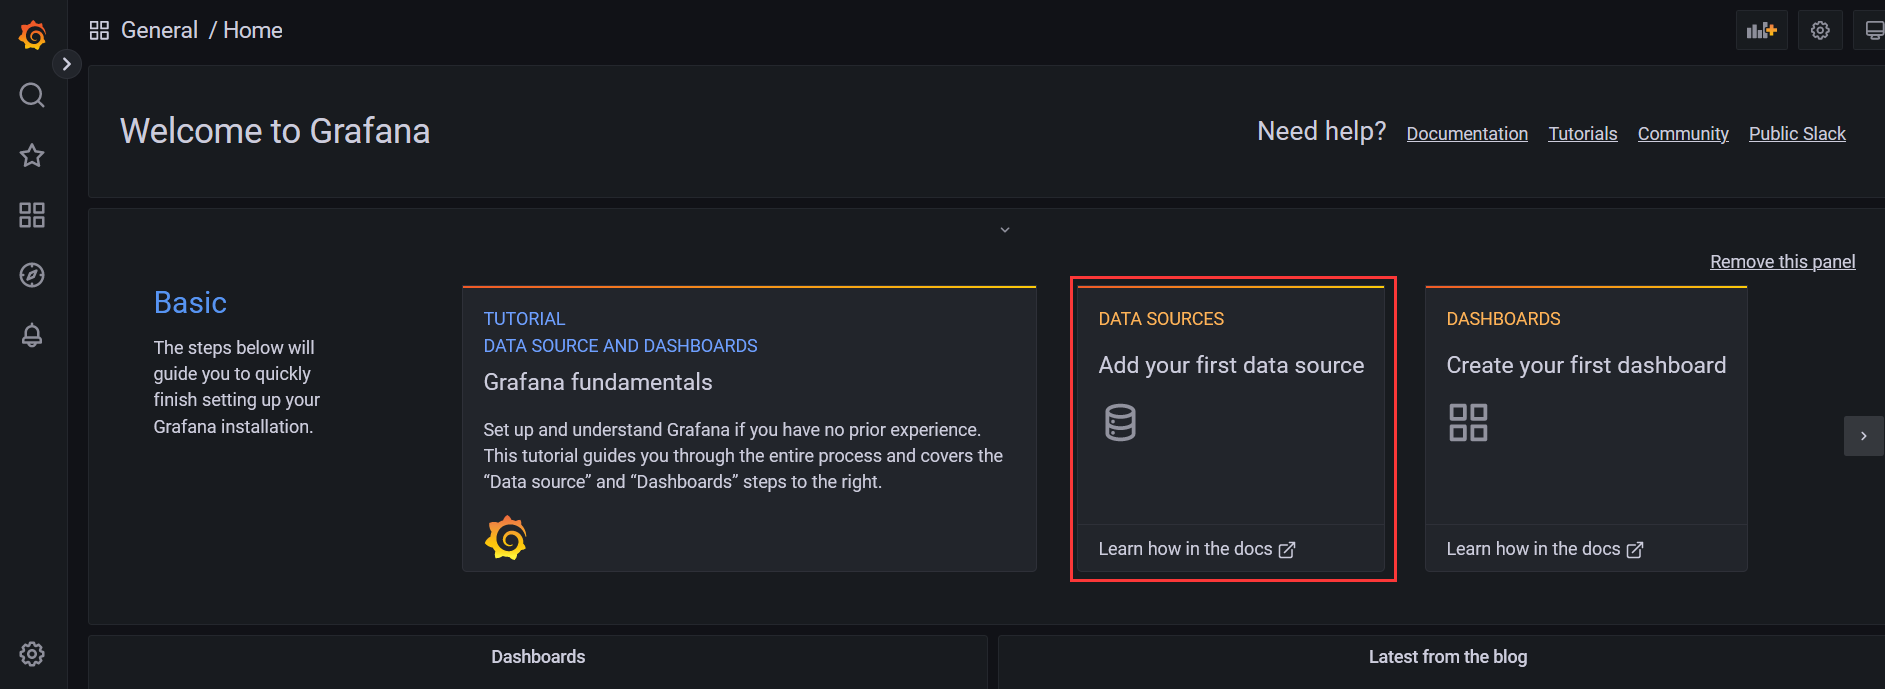
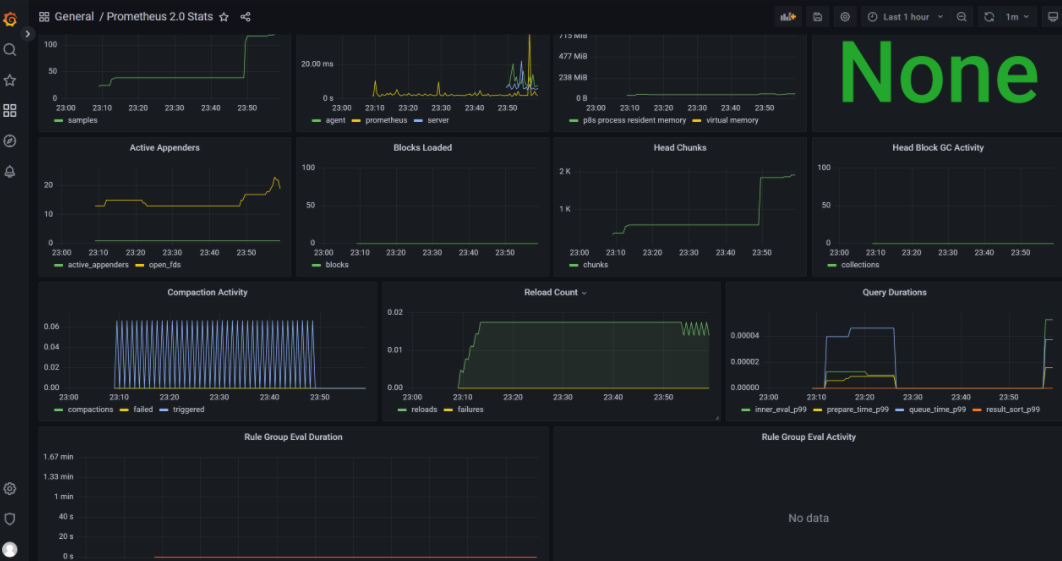
2.Grafana configuration
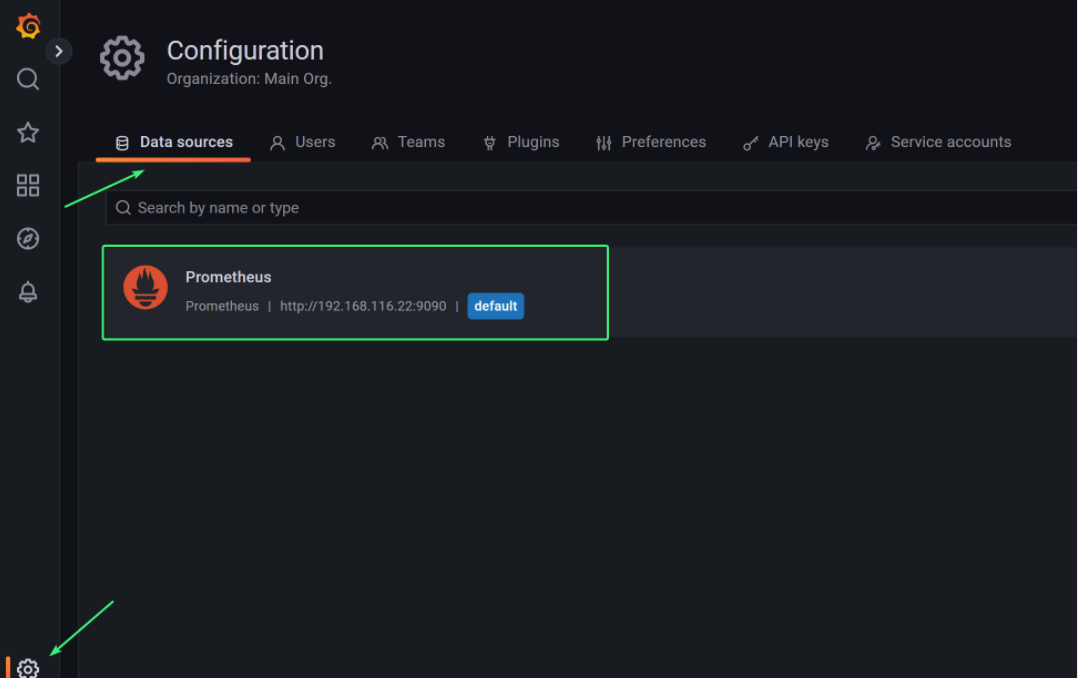
Click DATA SOURCRE to add the data source
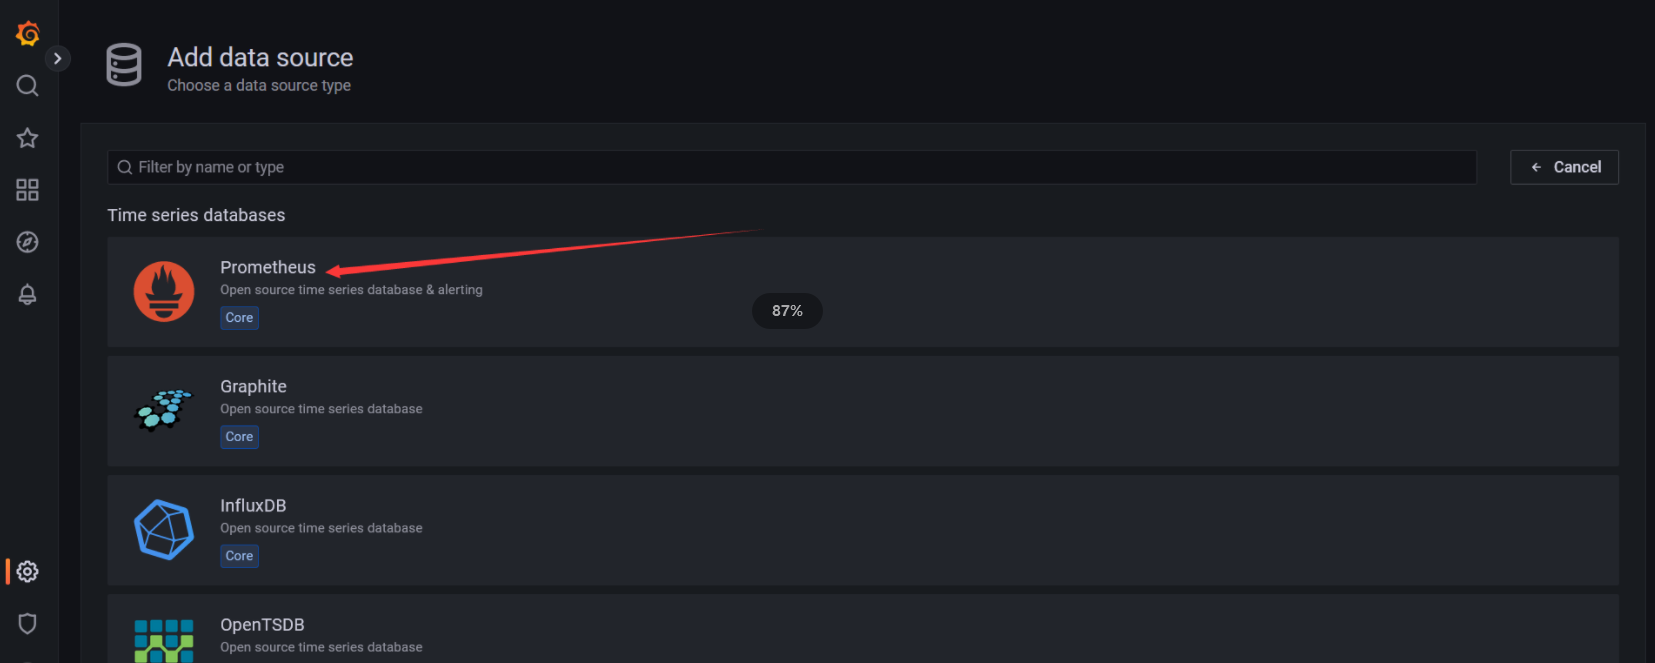
Select Prometheus
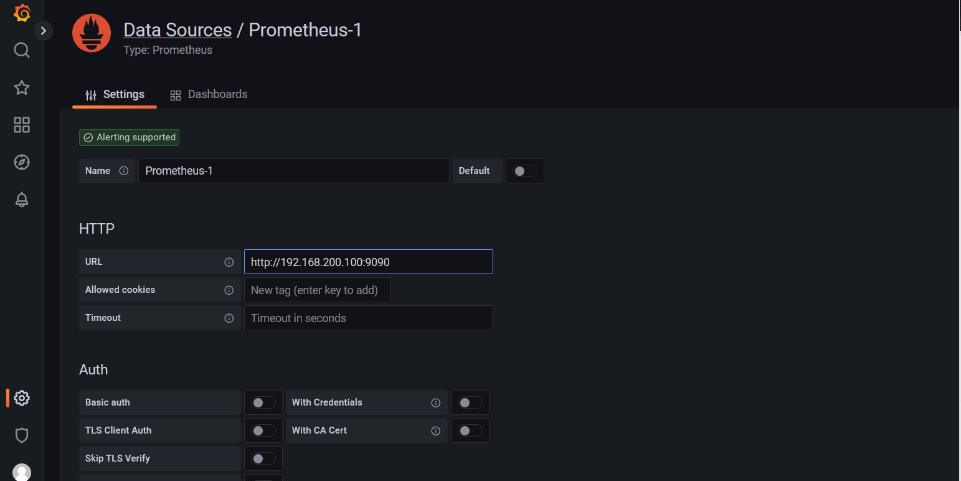
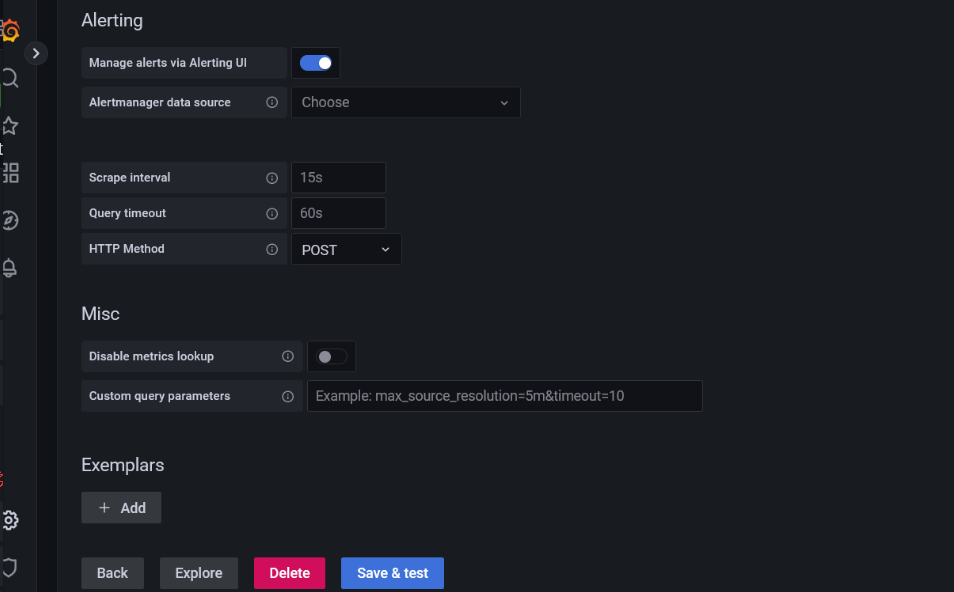
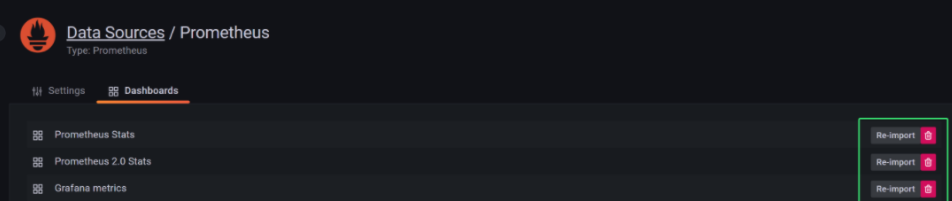
Added a successful data source view
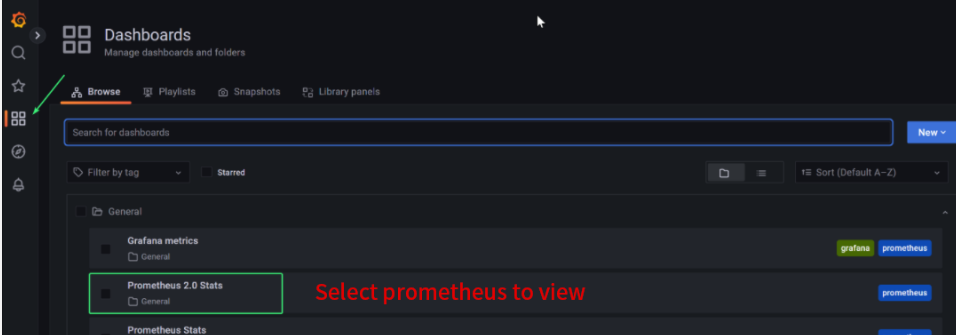
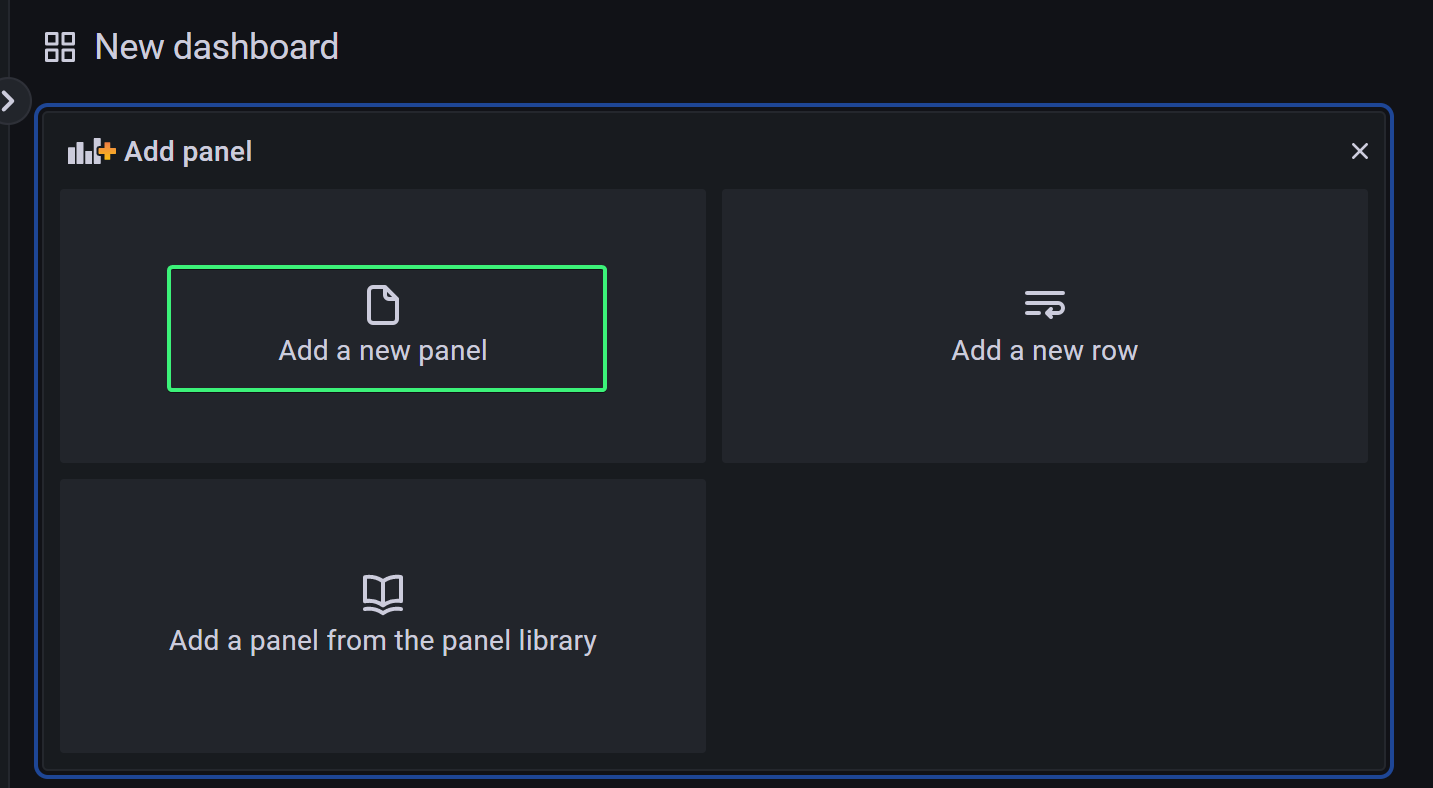
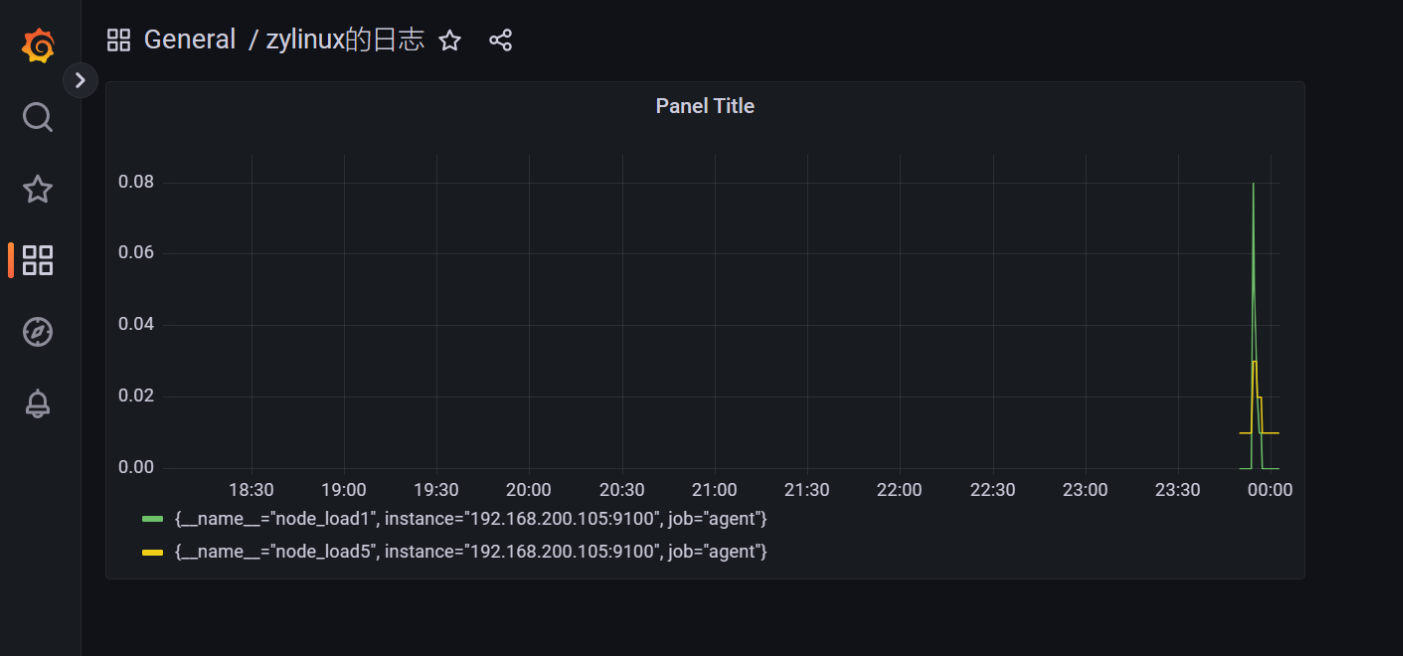
Define display content
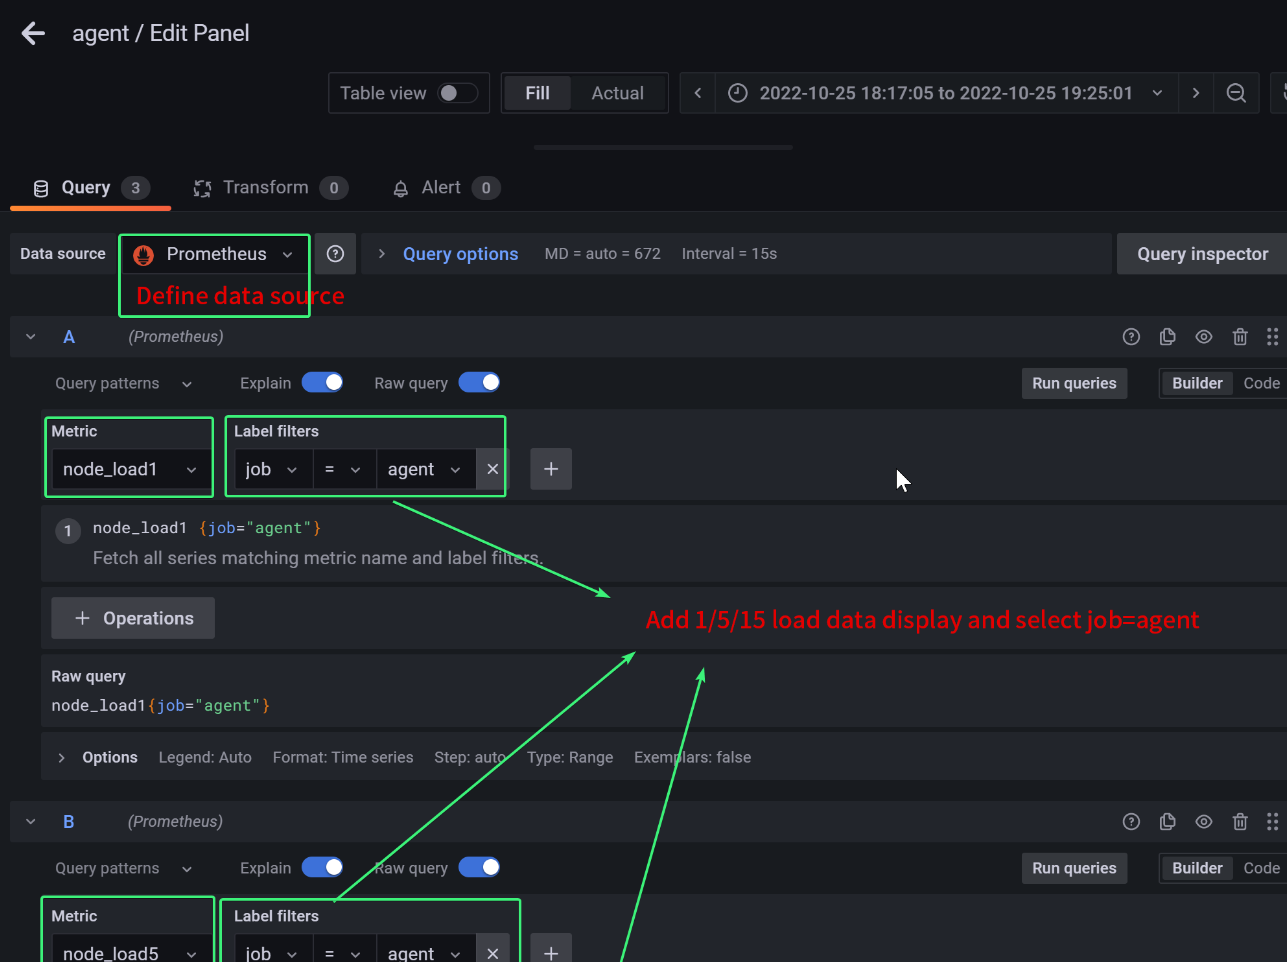
Name: agent - 192.168.200.104 Indicates the average load of the server
3. Detailed user guide
Refer to the Grafana official course: https://grafana.com/docs/grafana/latest/
Refer to the Prometheus official course: https://prometheus.io/docs/introduction/overview/
4. Related commands
- Check Grafana status: `sudo systemctl status grafana-server`
- Start Grafana: `sudo systemctl start grafana-server`
- Stop Grafana: `sudo systemctl stop grafana-server`
- Restart Grafana: `sudo systemctl restart grafana-server`
- Enable Grafana to start on boot: `sudo systemctl enable grafana-server`
- Check Prometheus status: `sudo systemctl status prometheus`
- Start Prometheus: `sudo systemctl start prometheus`
- Stop Prometheus: `sudo systemctl stop prometheus`
- Restart Prometheus: `sudo systemctl restart prometheus`
- Enable Prometheus to start on boot: `sudo systemctl enable prometheus`
- Reload systemd: `sudo systemctl daemon-reload`
- Start Node Exporter: `sudo systemctl start node_exporter`
- Enable Node Exporter to start on boot: `sudo systemctl enable node_exporter`
- Check Node Exporter status: `sudo systemctl status node_exporter`
- Stop Node Exporter: `sudo systemctl stop node_exporter`
- Check open ports using netstat: `netstat -tunlp | grep port`
- Check the status of the firewalld service: `sudo systemctl status firewalld`
- Stop the firewalld service: `sudo systemctl stop firewalld`
- Start the firewalld service: `sudo systemctl start firewalld`
- Add a port (e.g., 3000, 9090, 9100) to the firewall rules: `sudo firewall-cmd --add-port=port/tcp --permanent`
- Reload firewall rules: `sudo firewall-cmd --reload`