InfluxDB and Grafana on CentOS Stream 9 with support by Fleximg
AWS-Marketplace
https://aws.amazon.com/marketplace/pp/prodview-lnpu7noi6kn2a
Usage Instructions
*Note
Before you start to access the system, please ensure the Status Checks of the instance in the AWS Console turns to 2/2 checks passed,
or the initialization process might be interrupted and the software configuration fails. It takes about 5-10 mins.
1. Log in to InfluxDB and Grafana
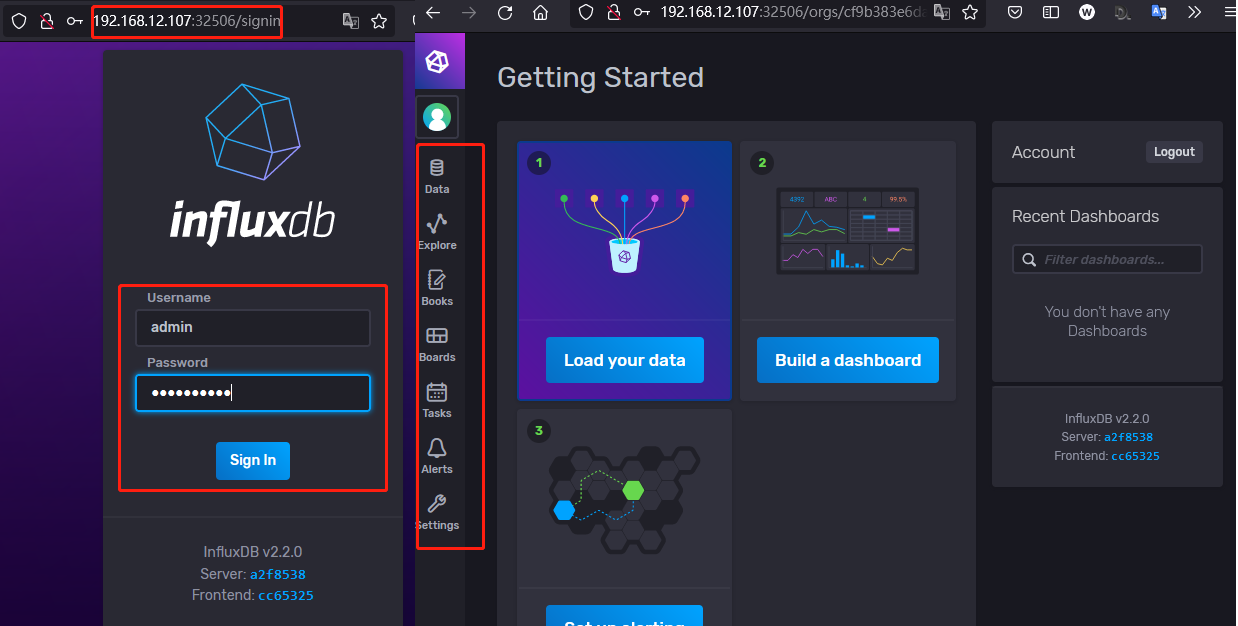
InfluxDB:
http://{your-host-ip}:8086/
Initial username: admin, password: Influxdb!123
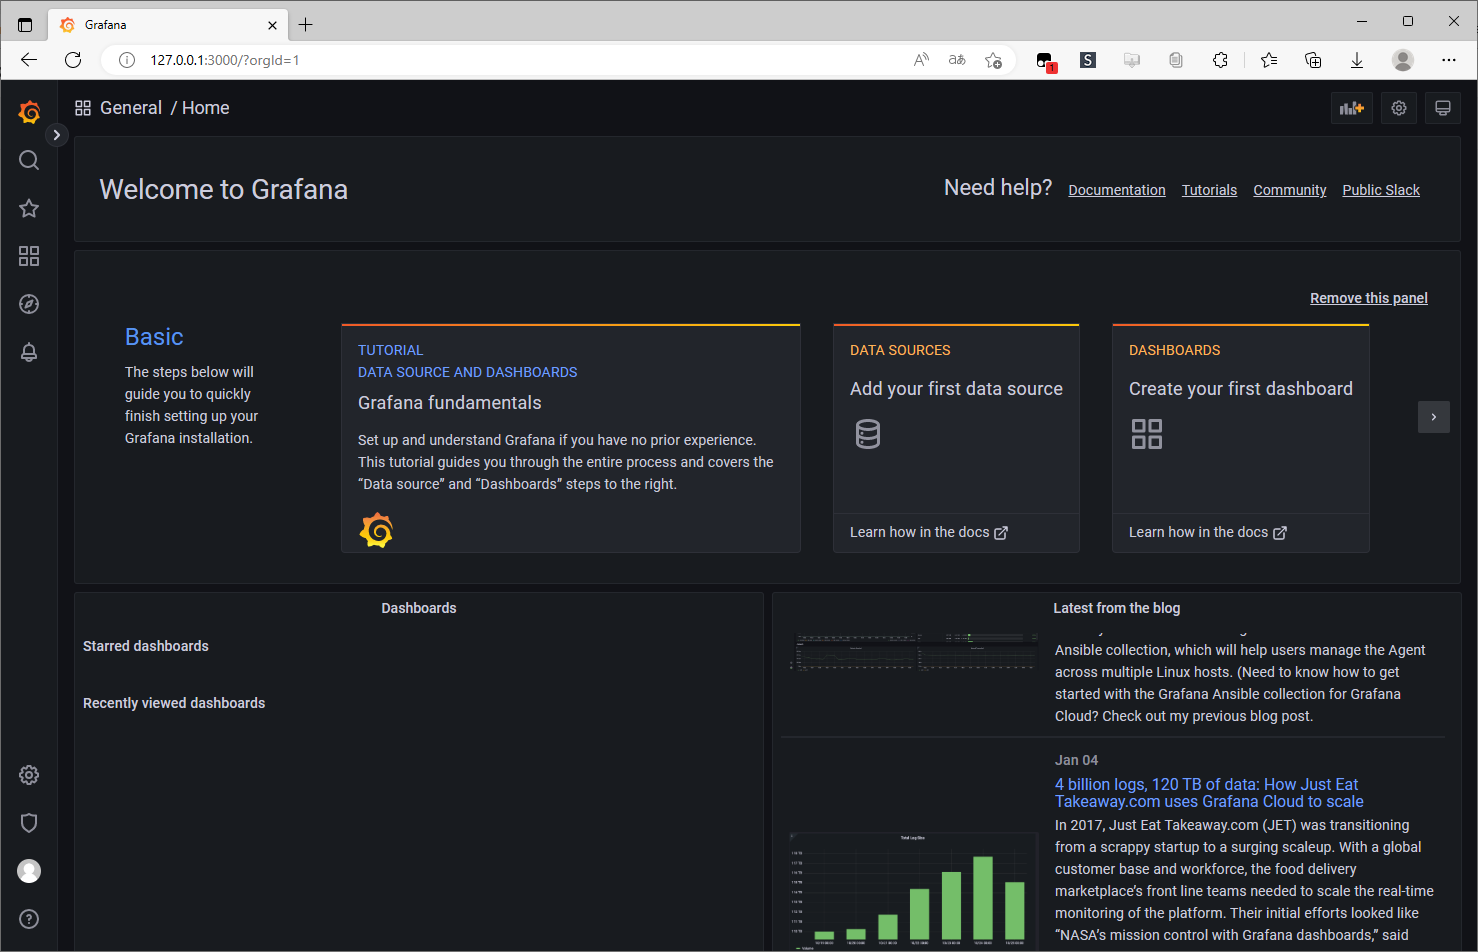
Grafana:
http://{your-host-ip}:3000/
Initial username: admin, password: Grafana!123
2. Detailed user guide
Refer to the Grafana official course: https://grafana.com/docs/grafana/latest/
Refer to the InfluxDB official course: https://docs.influxdata.com/influxdb/latest/introduction/get-started/
3. Related commands
- To check InfluxDB status: `sudo systemctl status influxdb`
- To start InfluxDB: `sudo systemctl start influxdb`
- To stop InfluxDB: `sudo systemctl stop influxdb`
- To restart InfluxDB: `sudo systemctl restart influxdb`
- To enable InfluxDB for startup: `sudo systemctl enable influxdb`
- To check Grafana status: `sudo systemctl status grafana-server`
- To start Grafana: `sudo systemctl start grafana-server`
- To stop Grafana: `sudo systemctl stop grafana-server`
- To restart Grafana: `sudo systemctl restart grafana-server`
- To enable Grafana for startup: `sudo systemctl enable grafana-server `
- Check Telegraf version: `telegraf --version`
- To check Telegraf status: `sudo systemctl status telegraf`
- To start Telegraf: `sudo systemctl start telegraf`
- To restart Telegraf: `sudo systemctl restart telegraf`
- To stop Telegraf: `sudo systemctl stop telegraf`
- To enable Telegraf for startup: `sudo systemctl enable telegraf`